
April Market Review
From Liberation to Limbo
Trade Policy Shock Waves Are Just Beginning to Reverberate
April 2025
Key Observations
- Tariff Escalation Raises Recession Risk: U.S. tariffs, despite a temporary pause, have intensified global trade tensions. Without policy offsets, the economic drag increases the likelihood of recession. Markets briefly rallied on tariff delays but remain vulnerable to policy uncertainty.
- Economic Placebo: The Bump, Then Fade: Tariffs could spark a short-term boost as consumers front-load purchases with the expectation of higher future prices. However, as higher costs hit profits and confidence, businesses and consumers may pull back.
- Core Market Drivers Still Matter Most: Tariffs have dominated headlines, but they do not dictate the full story. Fundamentals, like earnings growth, valuations, and bond yields, remain key drivers of long-term returns. Should growth falter, the Federal Reserve may pivot. And if tariff revenue is redirected into a “big, beautiful bill,” fiscal policy could become more supportive. Tariffs and the shifts in U.S. policy are clearly relevant, but they are not all-encompassing.
Market Recap
Liberation, Escalation, Respite, Limbo … The Current State of Things
April opened with a bang, marked by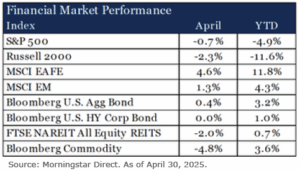 an assertive shift in U.S. trade policy. Even with a 90-day reciprocal tariff pause in place, the U.S. has implemented a 10% universal tariff, renegotiated trade agreements with Canada and Mexico, implemented auto tariffs, and engaged in a trade war with China, the world’s largest export economy. We could debate the merits or intent of these policies, but the reality is simple: They are here. And without meaningful resolution, monetary or fiscal offsets, their presence increases the probability that the U.S. economy slides into recession.
With many investors glued to ticker movements in recent weeks, we will keep this market recap concise and focus more deeply on the policy shifts driving the bigger picture.
In April, growth equities outpaced value across market capitalizations, as value-heavy sectors, like energy, materials, and financials, lagged behind growth-oriented sectors, such as technology and consumer sectors. International equities extended their lead, supported by a weaker U.S. dollar and relatively stronger local market performance. Mexico stood out, rising 13%, as tariff attention shifted from North America to other regions. While headline fixed income returns looked muted on the month, they were anything but beneath the surface. Yields on the long end of the curve spiked mid-month, pressuring bond prices down. Speculation swirled from rising inflation expectations and weak Treasury auction demand, foreign central bank selling, questions over the U.S. dollar’s reserve status, or even a hedge fund unwinding a position. But by month-end, cooler heads prevailed and the 30-year yield closed almost where it began: 4.66%.
Tariff Ripple Effects
We are reminded of Newton’s third law: For every action, there is an equal and opposite reaction. The global economy is contending with a powerful new force: tariffs. While the headline rates are easier to measure, the equal and opposite ripple effects are far more complex. A computer, for example, is built from thousands of components sourced from dozens of countries. Many of these parts cross borders multiple times before reaching the end consumer. That complexity does not cleanly translate to a new sticker price. Even if that complexity were fully transparent, it still would not be simple arithmetic. It is also a behavioral equation: how much cost companies will eat, how much they pass along, and how consumers respond. The reality is more tangled than any headlines may let on. In uncertain times, we must distill noise to primary signals, and in this case, we do so through pragmatic human behavior.
The Economic Shot Clock: A Bump, Then a Fade
Holding all else equal, meaning tariffs remain in place, our expectation is a temporary bump in economic activity and inflation, followed by a fade in both. Why the bump? Consumers may front-load purchases they believe will become more expensive, temporarily boosting retail sales and corporate earnings.
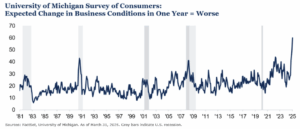
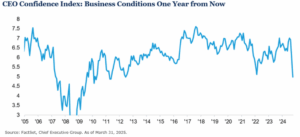
When this economic placebo fades and businesses and consumers face higher costs and growing uncertainty, they begin to pull back. This translates to something like “plan for the worst and hope for the best.” For businesses, planning for the worst rarely includes hiring. Additionally, as profits compress, costs come under the microscope. Falling corporate profits are among the most reliable leading indicators of rising unemployment. That is why we believe the economic shot clock is running. Sentiment clearly has shifted, as shown below, and without an offset or de-escalation, current policies are likely to exert greater downward pressure on the economy.
The Path(s) Forward
Any attempt at a prescriptive version of the future is fraught with error. We also know that reality rarely colors inside the lines we draw for it. That said, we can envision a number of likely paths in which this could unfold.
Door #1: A Tweet Will Set You Free
There is a non-zero chance that the current economic course we have set abruptly shifts. The same stroke of the pen that imposed tariffs could just as swiftly undo them. If so, while real economic damage has been done, markets may peer through their newly applied black eye and regain optimism.
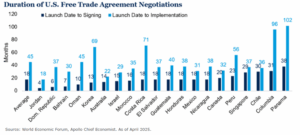
Door #2: It Takes Time, but Is Resolved in Time
The U.S. is currently navigating what we call an “event-led correction.” As a self-inflicted event, it also means the remedy is within reach. Over time, trade concessions are negotiated, and the market could slowly recalibrate. The key factor here is that it will take time, and in the interim, prices may continue to drift lower with uncertainty. In such an instance, a classic rebalance may be required, simply selling what has done well to buy what has done poorly. Yet, the dislocation may not be large enough to fundamentally alter our 10-year forward view, and we choose to rebalance back to the targeted allocations with which we began the year.
Door #3: Oops
Should the situation deteriorate further, the U.S. could shift from an event-led correction into a recession-led bear market. In that case, asset prices would likely decline sharply, and forward-looking assumptions would need to be reset. Still, such a scenario may also present opportunity. For example, in such an environment, wider credit spreads may offer more attractive entry points, potentially shifting our current positioning from a multi-year low to something more substantial.
Outlook
Tariffs have commanded much of our mental bandwidth recently, but several other forces remain equally, if not more, critical to market outcomes.
Market Conditions: Current valuations, the trajectory of earnings, and current fixed income yields matter greatly to future outcomes. These factors have a far stronger connection to forward returns than trade policy in isolation.
Monetary Policy: The Federal Reserve, thus far, has shown restraint, keeping policy in a relatively restrictive territory. However, we believe the Fed will act in good faith if clear signs of economic weakness emerge. While timing and magnitude remain uncertain, history suggests the Fed is more likely to support than to stand still if growth falters.
Fiscal Policy: It stands to reason that the receipts collected from tariffs will be used in the political budgetary machine to create equally stimulative fiscal policies, such as corporate and personal tax cuts, incentives for domestic manufacturing, or infrastructure. While no such details have emerged, if it is indeed “big” or “beautiful,” the markets may react favorably.
We believe our positioning coming into the year remains as relevant today as it did then. Fragility, durability, and the age of alpha help frame our positioning to weather both uncertainty and elevated volatility.
Disclosures & Definitions
Comparisons to any indices referenced herein are for illustrative purposes only and are not meant to imply that actual returns or volatility will be similar to the indices. Indices cannot be invested in directly. Unmanaged index returns assume reinvestment of any and all distributions and do not reflect our fees or expenses.
- The S&P 500 is a capitalization-weighted index designed to measure performance of the broad domestic economy through changes in the aggregate market value of 500 stocks representing all major industries.
- Russell 2000 consists of the 2,000 smallest U.S. companies in the Russell 3000 index.
- MSCI EAFE is an equity index which captures large and mid-cap representation across Developed Markets countries around the world, excluding the U.S. and Canada. The index covers approximately 85% of the free float-adjusted market capitalization in each country.
- MSCI Emerging Markets captures large and mid-cap representation across Emerging Markets countries. The index covers approximately 85% of the free-float adjusted market capitalization in each country.
- Bloomberg U.S. Aggregate Index covers the U.S. investment grade fixed rate bond market, with index components for government and corporate securities, mortgage pass-through securities, and asset-backed securities.
- Bloomberg U.S. Corporate High Yield Index covers the universe of fixed rate, non-investment grade debt. Eurobonds and debt issues from countries designated as emerging markets (sovereign rating of Baa1/BBB+/BBB+ and below using the middle of Moody’s, S&P, and Fitch) are excluded, but Canadian and global bonds (SEC registered) of issuers in non-EMG countries are included.
- FTSE NAREIT Equity REITs Index contains all Equity REITs not designed as Timber REITs or Infrastructure REITs.
- Bloomberg Commodity Index is calculated on an excess return basis and reflects commodity futures price movements. The index rebalances annually weighted 2/3 by trading volume and 1/3 by world production and weight-caps are applied at the commodity, sector and group level for diversification.
Material Risks
- Fixed Income securities are subject to interest rate risks, the risk of default and liquidity risk. U.S. investors exposed to non-U.S. fixed income may also be subject to currency risk and fluctuations.
- Cash may be subject to the loss of principal and over longer periods of time may lose purchasing power due to inflation.
- Domestic Equity can be volatile. The rise or fall in prices take place for a number of reasons including, but not limited to changes to underlying company conditions, sector or industry factors, or other macro events. These may happen quickly and unpredictably.
- International Equity can be volatile. The rise or fall in prices take place for a number of reasons including, but not limited to changes to underlying company conditions, sector or industry impacts, or other macro events. These may happen quickly and unpredictably. International equity allocations may also be impact by currency and/or country specific risks which may result in lower liquidity in some markets.
- Real Assets can be volatile and may include asset segments that may have greater volatility than investment in traditional equity securities. Such volatility could be influenced by a myriad of factors including, but not limited to overall market volatility, changes in interest rates, political and regulatory developments, or other exogenous events like weather or natural disaster.
- Private Real Estate involves higher risk and is suitable only for sophisticated investors. Real estate assets can be volatile and may include unique risks to the asset class like leverage and/or industry, sector or geographical concentration. Declines in real estate value may take place for a number of reasons including, but are not limited to economic conditions, change in condition of the underlying property or defaults by the borrower
This report is intended for the exclusive use of clients or prospective clients (the “recipient”) of BGM Wealth Partners and the information contained herein is confidential and the dissemination or distribution to any other person without the prior approval of BGM Wealth Partners is strictly prohibited. Information has been obtained from sources believed to be reliable, though not independently verified. Any forecasts are hypothetical and represent future expectations and not actual return volatilities and correlations will differ from forecasts. This report does not represent a specific investment recommendation. The opinions and analysis expressed herein are based on BGM Wealth Partners research and professional experience and are expressed as of the date of this report. Please consult with your advisor, attorney and accountant, as appropriate, regarding specific advice. Past performance does not indicate future performance and there is risk of loss.