

August 2026 Market Review
No Summer Break for the Bond Market
Hawks soar in Jackson Hole and Treasury policy increases volatility in markets.
August 2026
Key Observations
- August was a constructive but uneven month as investors balanced resilient equity returns against renewed pressure in the Treasury market, a more hawkish Federal Reserve tone, and lingering questions about inflation’s path.
- The Federal Reserve’s message grew more hawkish following Jackson Hole, pushing short-term yields higher and reinforcing that policy uncertainty remains a key driver of fixed income volatility.
- Geopolitical tensions remained a key source of market volatility, with U.S.-Iran hostilities lifting oil prices and supporting commodities as investors sought protection from supply risks and broader uncertainty.
Market Recap
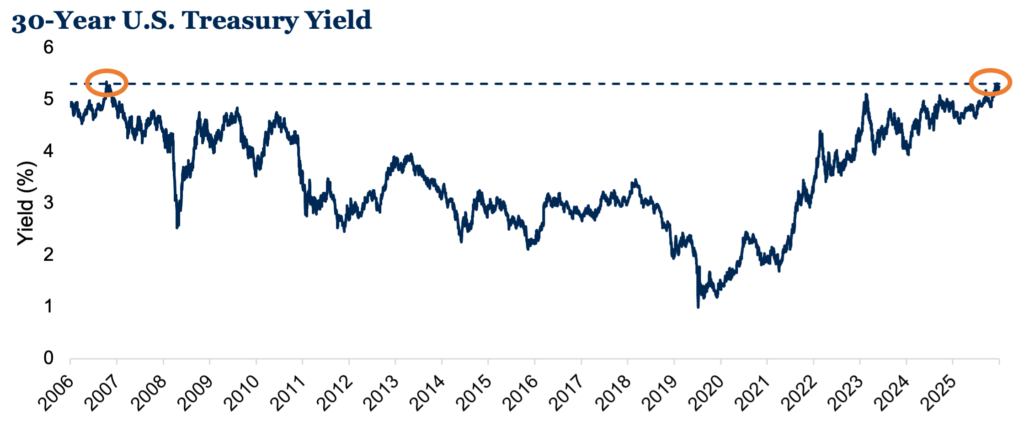
August kept investors on their toes, balancing familiar narratives from the year: resilient growth, sticky inflation, a Federal Reserve unwilling to commit to a direction, and a Middle East conflict that refuses to settle. The Federal Reserve’s tone grew more hawkish as the month progressed. At the Jackson Hole symposium late in the month, Fed Chair Kevin Warsh aimed to build credibility with markets, warning that the summer’s softer inflation readings did “not tell me that underlying trends have meaningfully improved,”1 signaling that rates could move higher. Markets repriced quickly. The odds of a September rate hike jumped from roughly one-in-three to better than half2, the 10-year Treasury yield climbed above 4.7%, and the 30-year reached its highest level since 2007. Late in the month, renewed U.S.-Iran hostilities around the Strait of Hormuz pushed oil higher and added a fresh layer of volatility.
U.S. equities advanced despite the hawkish backdrop. The S&P 500 gained 2.7% as investors looked past rising yields and leaned into energy and materials. Beneath the surface, leadership stayed broad, though smaller companies felt the drag of higher borrowing costs. The Russell 2000 rose a more modest 1.0%, as higher rates tempered enthusiasm for more rate-sensitive small caps even as the index held a 20.0% year-to-date gain.
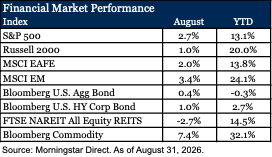
International markets participated in the rally. The MSCI EAFE Index returned 2.0%, supported by firmer economic activity in parts of Europe and the United Kingdom and helped by a modestly weaker U.S. dollar. Emerging markets outpaced developed markets once again. The MSCI Emerging Markets Index gained 3.4%, powered by strength in technology-heavy Asian markets, particularly South Korea and Taiwan, alongside a firm bid for materials tied to rising commodity prices. The asset class is now up 24.1% year-to-date.
Fixed income proved resilient even as yields pushed modestly higher on the front end of the curve. The Bloomberg U.S. Aggregate Bond Index returned 0.4%, as higher starting yields cushioned the impact. The rate move accelerated after Jackson Hole, with short-dated yields rising most as investors priced in a firmer Fed, building on a mid-month catalyst when the Treasury announced that it would increase its long-end buyback operations beginning in September. Credit held up well. The Bloomberg U.S. Corporate High Yield Index gained 1.0%, as healthy fundamentals and tight spreads kept the sector firmly in positive territory.
Real assets told two very different stories. Rising long-term rates weighed on property, and the FTSE NAREIT All Equity REITs Index fell 2.7%, giving back a portion of its year-to-date gain. Commodities, by contrast, were the month’s standout, with the Bloomberg Commodity Index climbing 7.4%. Energy led the charge as U.S. strikes on Iranian positions near the Strait of Hormuz and Tehran’s retaliation drove Brent crude above $90 per barrel late in the month, while precious metals surged as investors sought protection against geopolitical risk and mounting fiscal concerns.
The Bond Market’s Long Summer
Over the past three months, the U.S. bond market absorbed an oil shock, a new Federal Reserve chair, and the national debt crossing $40 trillion. Since mid-July the market added a hawkish hold, the highest long-term yields since 2007, an unscheduled Treasury intervention, and a Jackson Hole speech that reopened the door to rate hikes to create further uncertainty for bond investors. By September, the 10-year Treasury yield was roughly at its highest level since January 2025, while the 30-year was at its highest since 2007.
Source: FactSet. As of August 31, 2026.
One of the closely watched events for investors this summer was the July 29 FOMC meeting that held the funds rate at 3.50–3.75% with three dissents in favor of tightening. Chair Warsh declined to provide forward guidance, describing it as a crisis-era practice that “overstayed its welcome,” and noted that tighter financial conditions were doing some of the Fed’s work. Markets read the lack of guidance as concerning, leading the 30-year Treasury yield to rise approximately 10 basis points to 5.2% that afternoon. The Dow posted its worst day in more than a year.3 When the 60-day U.S. and Iran negotiating window lapsed on August 17 with the Strait of Hormuz still constrained and crude above $90, the 30-year touched 5.3%, its highest since June 2007. The sell-off also pushed Japanese, German, and French long-dated yields to multi-decade highs. Warsh’s Jackson Hole remarks on August 28 then delivered the clarity July lacked: “We must be confident that underlying inflation is moving to our objective, clearly and at sufficient speed. Otherwise, we have work to do.”4 He reaffirmed 2% PCE as a “firm, fixed target” and named the policy rate as the Fed’s predominant tool, and the front end quickly repriced.4
What the Treasury Department Announced
In the midst of that news, the U.S. Treasury Department made two important announcements. The first was routine, emphasizing that the August 5 quarterly refunding window would offer $125 billion of 3-, 10-, and 30-year Treasury securities to refund $96.3 billion of maturing debt and raise $28.7 billion in new cash.5
The second announcement was less routine. On August 19, one day after the 30-year’s 19-year high, Treasury announced it would at least double the maximum size of its long-dated Treasury buyback operations from $2 billion to $4 billion between September 9 and November 4, a move Secretary Bessent described as a “Treasury Twist” and which senior officials later suggested could be funded from the Treasury General Account rather than Treasury bill issuance.6 The 30-year fell roughly 10 basis points but reversed the move the following day. Debt outstanding crossed $40 trillion the same day. The larger question the episode raised is “who now owns the long end of the curve?” A Fed that says it wants markets to tighten on data, or a Treasury that has shown it will step in when rates do rise?
Twenty-Five Years of Context
Investors reading this have lived through one of the most important regime shifts in fixed income markets in decades. In 2000, the 10-year yielded roughly 6.5%. Following the Global Financial Crisis, we had several years of zero rates, multiple rounds of quantitative easing, and a 40-year fixed income bull market that culminated in August 2020 with the 10-year near 0.5%. For most of that period bonds were both income and insurance, paying a coupon and generally rallying when equities fell. That relationship started to break in 2022. The Bloomberg U.S. Aggregate lost roughly 13%, its worst calendar year on record, and stocks and bonds fell together. One of the key culprits has been what Warsh himself pointed out in Jackson Hole: inflation has been above target for 65 consecutive months.
The challenge for fixed income today is not that yields are low. It is that the assumptions embedded in 2000–2020 portfolio construction no longer hold together: that duration diversifies equities, that the Fed’s reaction function is knowable, and that Treasury supply is a policy afterthought. Three observations about today’s environment follow:
- Income is positive after inflation again, with the Aggregate Bond Index yielding 5.1%, against expected inflation of 2.3%, offering positive real carry across the curve for the first time in many years. Looking forward, the coupon may help offset interest rate volatility.
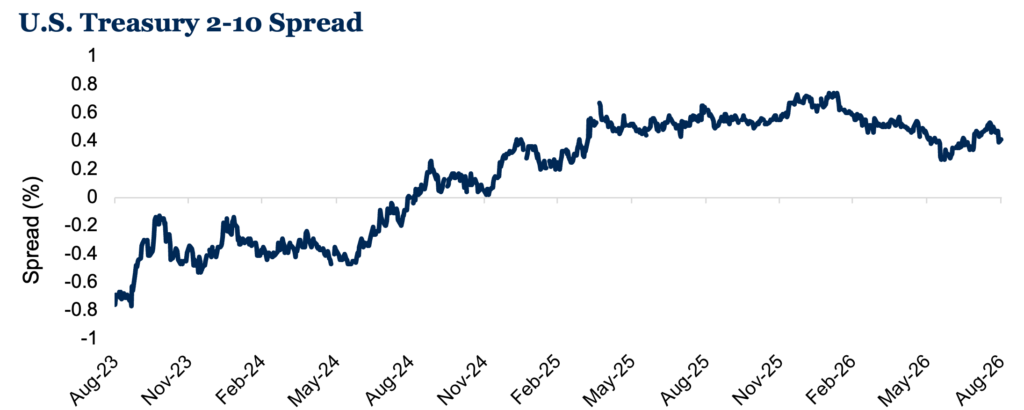
- Duration is a two-sided risk, but the risks are not symmetrical. The front end is anchored by a Fed contemplating hikes and the long end is priced off fiscal supply, geopolitics, global rates, and the credibility of a Treasury willing to intervene. The spread between short-term yields and long-term yields reflects a term premium that has been rebuilding and may continue.
Source: FactSet. As of August 31, 2026.
- Policy risk is migrating to the Treasury. Coupon sizes are staying the same, T-bills are growing to absorb the deficit, buybacks are now being introduced as a rate-management tool, and a $1 trillion cash balance is being discussed as a source of funds. Treasury’s longstanding “regular and predictable” issuance approach is evolving, with potential impacts to the Treasury market’s liquidity and pricing.
For portfolios, the practical implication is that today’s elevated fixed income yields may allow clients to seek income without assuming the full uncertainty associated with longer-dated bonds.
Outlook
August reinforced that investors continue to navigate a market shaped by resilient growth, elevated rates, persistent inflation concerns, and unresolved geopolitical risks. While equities have broadened and select risk assets have continued to participate in the rally, the bond market’s recent volatility underscores that the path forward may remain uneven as markets reassess the balance between income, duration risk, and policy uncertainty. We continue to favor balanced portfolios that can participate in a broader opportunity set while emphasizing diversification, quality, and thoughtful fixed income positioning, as higher yields once again provide meaningful income but require greater selectivity.
Footnotes
1 Fed Chair Kevin Warsh at “Financial Innovation: Implications for Payments and Policy,” an economic policy symposium sponsored by the Federal Reserve Bank of Kansas City, Jackson Hole, Wyoming. August 28, 2026.
2 CME FedWatch. As of August 31, 2026.
3 FactSet. As of August 31, 2026.
4 Fed Chair Kevin Warsh at “Financial Innovation: Implications for Payments and Policy,” an economic policy symposium sponsored by the Federal Reserve Bank of Kansas City, Jackson Hole, Wyoming. August 28, 2026.
5 U.S. Treasury. As of August 5, 2026.
6 U.S. Treasury. As of August 19, 2026.
Disclosures & Definitions
Comparisons to any indices referenced herein are for illustrative purposes only and are not meant to imply that actual returns or volatility will be similar to the indices. Indices cannot be invested in directly. Unmanaged index returns assume reinvestment of any and all distributions and do not reflect our fees or expenses. Market returns shown in text are as of the publish date and sourced from Morningstar or FactSet unless otherwise listed.
- The S&P 500 is a capitalization-weighted index designed to measure performance of the broad domestic economy through changes in the aggregate market value of 500 stocks representing all major industries.
- Russell 2000 consists of the 2,000 smallest U.S. companies in the Russell 3000 index.
- Russell 2000 Growth measures the performance of the Russell 2000 companies with higher P/B ratios and higher forecasted growth values.
- MSCI EAFE is an equity index which captures large and mid-cap representation across Developed Markets countries around the world, excluding the U.S. and Canada. The index covers approximately 85% of the free float-adjusted market capitalization in each country.
- MSCI Emerging Markets captures large and mid-cap representation across Emerging Markets countries. The index covers approximately 85% of the free-float adjusted market capitalization in each country.
- Bloomberg U.S. Aggregate Index covers the U.S. investment grade fixed rate bond market, with index components for government and corporate securities, mortgage pass-through securities, and asset-backed securities.
- Bloomberg U.S. Corporate High Yield Index covers the universe of fixed rate, non-investment grade debt. Eurobonds and debt issues from countries designated as emerging markets (sovereign rating of Baa1/BBB+/BBB+ and below using the middle of Moody’s, S&P, and Fitch) are excluded, but Canadian and global bonds (SEC registered) of issuers in non-EMG countries are included.
- FTSE NAREIT Equity REITs Index contains all Equity REITs not designed as Timber REITs or Infrastructure REITs.
- Bloomberg Commodity Index is calculated on an excess return basis and reflects commodity futures price movements. The index rebalances annually weighted 2/3 by trading volume and 1/3 by world production and weight-caps are applied at the commodity, sector and group level for diversification.
Material Risks
- Fixed Income securities are subject to interest rate risks, the risk of default and liquidity risk. U.S. investors exposed to non-U.S. fixed income may also be subject to currency risk and fluctuations.
- Cash may be subject to the loss of principal and over longer periods of time may lose purchasing power due to inflation.
- Domestic Equity can be volatile. The rise or fall in prices take place for a number of reasons including, but not limited to changes to underlying company conditions, sector or industry factors, or other macro events. These may happen quickly and unpredictably.
- International Equity can be volatile. The rise or fall in prices take place for a number of reasons including, but not limited to changes to underlying company conditions, sector or industry impacts, or other macro events. These may happen quickly and unpredictably. International equity allocations may also be impacted by currency and/or country specific risks which may result in lower liquidity in some markets.
- Real Assets can be volatile and may include asset segments that may have greater volatility than investment in traditional equity securities. Such volatility could be influenced by a myriad of factors including, but not limited to overall market volatility, changes in interest rates, political and regulatory developments, or other exogenous events like weather or natural disaster.
- Private Real Estate involves higher risk and is suitable only for sophisticated investors. Real estate assets can be volatile and may include unique risks to the asset class like leverage and/or industry, sector or geographical concentration. Declines in real estate value may take place for a number of reasons including, but are not limited to economic conditions, change in condition of the underlying property or defaults by the borrower.
- All investing involves risk including the potential loss of principal. Market volatility may significantly impact the value of your investments. Recent tariff announcements may add to this volatility, creating additional economic uncertainty and potentially affecting the value of certain investments. Tariffs can impact various sectors differently, leading to changes in market dynamics and investment performance. You should consider these factors when making investment decisions. We recommend consulting with a qualified financial adviser to understand how these risks may affect your portfolio and to develop a strategy that aligns with your financial goals and risk tolerance.