
July Market Review
Calm Above, Currents Below
Strong earnings season and resilient economy give way to a weak July employment report.
July 2025
Key Observations
- Markets were mixed in July as equities delivered modest positive returns amidst a favorable earnings backdrop and resilient economic data.
- Clarity around trade policy ahead of the August 1 deadline helped give investors a better grasp of what’s to come with key trade deals being made with the EU, U.K., and Japan.
- Earnings season began with solid fundamentals, but markets remain fragile as misses on expectations were punished and high valuations persist.
- A disappointing July employment report heightened investor uncertainty and the future path of interest rate decisions by the Federal Reserve.
Market Recap
July brought a mix of resilience and recalibration across global markets. Investors navigated a landscape shaped by ever-fluent trade policy, ongoing geopolitical tensions, and a resilient macro backdrop. Equity markets, for the most part, moved higher, buoyed by a strong start to earnings season and better-than expected economic data. Additional clarity on trade policy helped as well, as deals were made with key partners such as the United Kingdom, European Union, and Japan before the August 1 deadline.
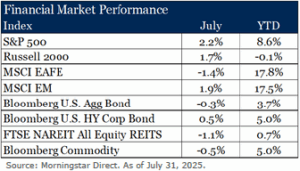 U.S. gross domestic product (GDP) grew at 3.0 percent in the second quarter, driven primarily by consumer spending and a reduction in imports, and the labor market had continued to be resilient until the last week of the month (more on that below). The S&P 500 Index reached new highs, rising 2.2 percent to start the second half of the year. Technology and energy sectors were standouts, with the former gaining over 5.0 percent as AI-driven optimism persisted and the latter benefiting from rising oil prices amidst continued tensions in the Middle East. Small cap equities (Russell 2000 Index) modestly lagged their large-cap counterparts, gaining 1.7 percent in the month.
Abroad, developed markets, as measured by the MSCI EAFE Index, slipped 1.4 percent. Weakness in European markets, particularly Germany and Switzerland, offset modest gains in the U.K. and Italy. Currency effects weighed on returns, as the U.S. dollar strengthened modestly against major peers. Despite the modest pullback, international equities remain well ahead of domestic year-to-date. Emerging markets rose 1.9 percent in July. China was the standout, gaining almost 5 percent, driven by policy support and improving sentiment around regulation. Broader EM strength was also supported by gains in Korea, though India declined amid ongoing trade uncertainty and an increase in threatened tariffs.
Fixed income markets were mixed. The Bloomberg U.S. Aggregate Bond Index slipped 0.3 percent in July as investors digested mixed signals from the Federal Reserve. The FOMC held rates steady in July amid persistent inflation and uneven market data. It was not a unanimous decision, as there were two dissenting votes, the first time since 1993. Rates moved higher over the course of the month, driven by lingering inflation concerns, deficit expansion, and the market’s reduced outlook for recession in the near term. High-yield bonds fared better, buoyed by a strong earnings season, a favorable economic backdrop, and continued investor appetite for yield. The asset class has now returned approximately 5 percent year-to-date.
REITs struggled in July. Positive sentiment on the economy was not enough to offset weakness in self-storage, residential, and office. Rising rates and a reduced outlook for Fed cuts were a headwind for the asset class. Commodities were mixed but ultimately ended the month lower. Concerns about trade policy negatively impacted industrial metals, with copper prices plummeting 25 percent in the last week of the month. Energy prices were modestly firmer amidst geopolitical tensions around the world.
Strong Earnings, High Expectations
The second quarter earnings season continues to deliver upside surprises, with broad-based growth and strong beat rates. However, stretched valuations, shifting economic data, and a disproportionate penalty for companies that have missed estimates may suggest we are entering into a more discerning phase. As of August 1, 66 percent of S&P 500 companies have reported results for the second quarter. Despite the mixed macro backdrop, 82 percent have reported a positive earnings surprise, and the blended year-over-year growth rate is currently 10.3 percent. Information technology, communications, and consumer discretionary continue to be a standout among sectors, driven by some of the “Magnificent 7” names, while energy was a laggard on the back of falling year-over-year oil prices. Market reaction has been sharp. Companies beating EPS estimates are seeing an average price increase of 0.9 percent in the two days around the announcement, roughly in line with the five-year average. Misses have been punished more severely, with an average decline of 5.6 percent, worse than the recent past, and a prime example of the fragility that persists in markets today.
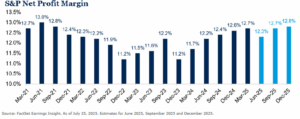
Tariff-related concerns and the potential impact on higher cost of goods and inflation have investors wondering about the impact on company fundamentals. While it is still early to feel the full impact of trade policy, there may be room for companies to absorb some of the added cost pressures. Margins remain healthy. The net profit margin for the S&P 500 is 12.3 percent, slightly down versus the prior quarter but above the five-year average. Margin expansion is evident in sectors such as communication services, information technology, and financials, while energy and real estate margins have contracted.
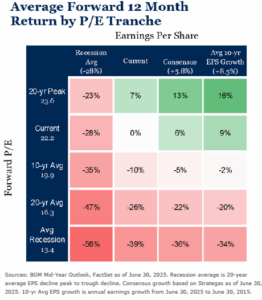 Fundamentals remain favorable, yet valuations remain elevated. The forward 12-month P/E ratio for the S&P 500 hovers near 22 times earnings, well above long-term averages. This premium reflects optimism but raises the bar for earnings to continue delivering. So far, the second quarter earnings results are broadly encouraging. Companies are managing costs well and delivering solid earnings growth. However, investors appear more selective, with clear sector divergences and heightened sensitivity to misses. With valuations rich and expectations high, upcoming quarters will require consistent delivery to sustain current market levels. Markets remain fragile, and should investor confidence or earnings weaken, the path forward for U.S. equities becomes more uncertain.
July Employment Report Creates More Uncertainty
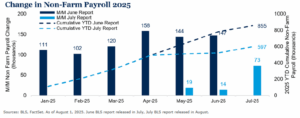
There was no shortage of economic data released during the month, but perhaps the most significant was the July employment report, which technically did not have market implications for the month of July as the report was released on August 1. That said, it is worth highlighting, nonetheless, as there was a considerable shift in the data from a month earlier. The labor market, for the most part, had been on a relatively stable footing for much of the last 12 months, hovering between 4.0-4.2 percent unemployment with steady monthly gains. However, July brought a different perspective with only 73,000 new jobs added in the month, well below the consensus estimate of 115,000. While the miss is concerning, the largest takeaway from the report was the significant revision for May and June, reducing the combined number of jobs by 258,000(!) from what was originally released.
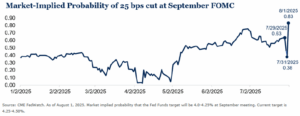
Up until recently, hard economic data had been resilient in the face of the Trump administration’s tariffs, but the revised data certainly begs the question: Are we starting to see the impact already? Further, the recent jobs report fueled the volatility of market expectations for when the Federal Reserve would cut rates. Expectations had been above 50 percent heading into the FOMC’s July meeting, but following Fed Chair Powell’s press conference, which markets took to be “hawkish,” the probability dropped to below 40 percent. The roller coaster didn’t stop, and following the recent employment report, expectations for a 25-basis-point cut in September jumped to over 80 percent. The Fed has held steadfast in its “data dependent” approach, and there is one additional employment report to digest before the next Fed meeting in September, but the July employment release will be impossible to ignore as the committee balances its dual mandate of stable inflation and full employment.
Outlook
Looking ahead, the global economic outlook remains cautiously optimistic. The IMF revised its 2025 global growth forecast slightly higher, citing improved financial conditions and fiscal expansion in key markets. Still, risks remain. Inflation in the U.S. continues to run above target, the recent July employment report is anything but rosy, and geopolitical tensions, from the Middle East to trade disputes, could quickly shift market dynamics. In this environment, diversification and discipline remain essential. July’s performance underscored
the importance of balancing opportunity with risk, especially as markets evolve into a complex and uncertain investment landscape.
Sources
- Bureau of Economic Analysis. Advance estimate for Q2 2025 GDP. As of July 30, 2025.
- FactSet Earnings Insight Analysis. Advance estimate for Q2 2025 GDP. As of July 30, 2025.
- FactSet Earnings Insight. As of July 25, 2025.
- BLS, FactSet. As of August 1, 2025.
- IMP World Economic Outlook July 2025.
This report is intended for the exclusive use of clients or prospective clients (the “recipient”) of BGM Wealth Partners and the information contained herein is confidential and the dissemination or distribution to any other person without the prior approval of BGM Wealth Partners is strictly prohibited. Information has been obtained from sources believed to be reliable, though not independently verified. Any forecasts are hypothetical and represent future expectations and not actual return volatilities and correlations will differ from forecasts. This report does not represent a specific investment recommendation. The opinions and analysis expressed herein are based on BGM Wealth Partners research and professional experience and are expressed as of the date of this report. Please consult with your advisor, attorney and accountant, as appropriate, regarding specific advice. Past performance does not indicate future performance and there is risk of loss.
Disclosures & Definitions
Comparisons to any indices referenced herein are for illustrative purposes only and are not meant to imply that actual returns or volatility will be similar to the indices. Indices cannot be invested in directly. Unmanaged index returns assume reinvestment of any and all distributions and do not reflect our fees or expenses.
- The S&P 500 is a capitalization-weighted index designed to measure performance of the broad domestic economy through changes in the aggregate market value of 500 stocks representing all major industries.
- Russell 2000 consists of the 2,000 smallest U.S. companies in the Russell 3000 index.
- MSCI EAFE is an equity index which captures large and mid-cap representation across Developed Markets countries around the world, excluding the U.S. and Canada. The index covers approximately 85% of the free float-adjusted market capitalization in each country.
- MSCI Emerging Markets captures large and mid-cap representation across Emerging Markets countries. The index covers approximately 85% of the free-float adjusted market capitalization in each country.
- Bloomberg U.S. Aggregate Index covers the U.S. investment grade fixed rate bond market, with index components for government and corporate securities, mortgage pass-through securities, and asset-backed securities.
- Bloomberg U.S. Corporate High Yield Index covers the universe of fixed rate, non-investment grade debt. Eurobonds and debt issues from countries designated as emerging markets (sovereign rating of Baa1/BBB+/BBB+ and below using the middle of Moody’s, S&P, and Fitch) are excluded, but Canadian and global bonds (SEC registered) of issuers in non-EMG countries are included.
- FTSE NAREIT Equity REITs Index contains all Equity REITs not designed as Timber REITs or Infrastructure REITs.
- Bloomberg Commodity Index is calculated on an excess return basis and reflects commodity futures price movements. The index rebalances annually weighted 2/3 by trading volume and 1/3 by world production and weight-caps are applied at the commodity, sector and group level for diversification.
Material Risks
- Fixed Income securities are subject to interest rate risks, the risk of default and liquidity risk. U.S. investors exposed to non-U.S. fixed income may also be subject to currency risk and fluctuations.
- Cash may be subject to the loss of principal and over longer periods of time may lose purchasing power due to inflation.
- Domestic Equity can be volatile. The rise or fall in prices take place for a number of reasons including, but not limited to changes to underlying company conditions, sector or industry factors, or other macro events. These may happen quickly and unpredictably.
- International Equity can be volatile. The rise or fall in prices take place for a number of reasons including, but not limited to changes to underlying company conditions, sector or industry impacts, or other macro events. These may happen quickly and unpredictably. International equity allocations may also be impacted by currency and/or country specific risks which may result in lower liquidity in some markets.
- Real Assets can be volatile and may include asset segments that may have greater volatility than investment in traditional equity securities. Such volatility could be influenced by a myriad of factors including, but not limited to overall market volatility, changes in interest rates, political and regulatory developments, or other exogenous events like weather or natural disaster.
- Private Real Estate involves higher risk and is suitable only for sophisticated investors. Real estate assets can be volatile and may include unique risks to the asset class like leverage and/or industry, sector or geographical concentration. Declines in real estate value may take place for a number of reasons including, but are not limited to economic conditions, change in condition of the underlying property or defaults by the borrower.
- All investing involves risk including the potential loss of principal. Market volatility may significantly impact the value of your investments. Recent tariff announcements may add to this volatility, creating additional economic uncertainty and potentially affecting the value of certain investments. Tariffs can impact various sectors differently, leading to changes in market dynamics and investment performance. You should consider these factors when making investment decisions. We recommend consulting with a qualified financial adviser to understand how these risks may affect your portfolio and to develop a strategy that aligns with your financial goals and risk tolerance.