November Market Review
Riding the Wave
Post-Election Optimism Fuels U.S. Markets While Global Uncertainty Lingers
November 2024
Key Observations
- A Republican victory fueled a rally in the U.S. equity markets in anticipation of pro-business policies such as potential deregulation and tax cuts.
- The U.S. dollar appreciated, reflecting expectations of inflationary fiscal policies and potential shifts in Federal Reserve actions.
- The Federal Reserve and Bank of England cut rates by 25 basis points, citing a need to support economic growth amid moderating inflation.
Market Recap
November was a dynamic month across financial markets, shaped by the interplay of easing inflation, political shifts, and evolving investor sentiment. As economic indicators pointed to moderating growth and a cooling labor market, consumer spending remained robust, even as rising household debt hinted at potential cracks in the foundation. Investors are bracing for a gradual economic slowdown into 2025, with the Federal Reserve signaling a cautious, data-driven approach to monetary policy.
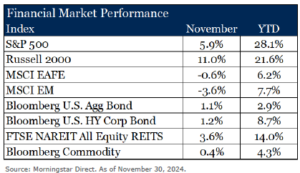
U.S. equity markets led the charge higher during the month, with large cap rising 6% on expectations of deregulation and tax reforms following the recent election. Positive earnings reports and robust consumer spending further bolstered confidence. Small-caps were a standout during the month on ower valuations, making them more attractive to investors amid risk-on sentiment. However, international developed and emerging markets underperformed, weighed down by a stronger U.S. dollar and concerns about economic stability in China, particularly in real estate and trade policy.
Central banks continued their easing stance, with the Federal Reserve and the Bank of England cutting rates by 25 basis points each. U.S. bond markets saw modest returns as inflation concerns and fiscal policy uncertainties limited gains. In Europe, political instability and rising inflation created mixed results, while Japan’s bonds declined due to anticipated monetary tightening. Credit spreads tightened further during the month on low supply, and resilient corporate fundamentals supported gains in high yield.
The U.S. dollar rose sharply during the month, influencing global trade and asset performance. Commodity markets were mixed as natural gas prices surged due to supply disruptions while precious metals saw profit-taking amid rising geopolitical tensions. Real estate rose during the month as elevated rates continued to dampen home sales, and the presidential election introduced hesitation in the market, with both buyers and sellers adopting a “wait and see” approach regarding potential policy changes. Other notable real estate sectors were resorts and data centers, which benefited from increased consumer traveling and continuing demand for cloud computing and artificial intelligence.
The Power of Compounding
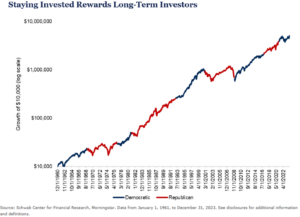
With the U.S. presidential election behind us and U.S. equity markets surging, questions around portfolio strategy often arise. History suggests market timing around elections can erode value.

We illustrate this concept in the above chart using cumulative monthly returns of the Ibbotson US Large Stock Index dating back to 1961. The cumulative returns across Democrat and Republican administrations reveal a stark truth: Maintaining a long-term, unbiased investment approach yields the most significant growth.
While we would avoid drawing any definitive conclusion from this chart on partisan cycles, the data clearly underscores the importance of staying invested through political cycles. In fact, staying invested through political regimes yielded nearly 10 times higher return than only investing when either Democrats or Republicans are in office.1 We believe portfolio success often depends on resilience and discipline rather than reacting to short-term events. As such, we recommend that investors keep investment decisions independent of political outcomes when building long-term portfolios.
Outlook
As the U.S. transitions power, uncertainty around tariffs, taxes, and regulation will dominate headlines. However, elections often generate more noise than signal for long-term investors. Our focus remains
on constructing durable portfolios and partnering with skilled managers to generate alpha in challenging conditions.
Sources
1.Schwab Center for Financial Research, Morningstar. Data from January 1, 1961, to December 31, 2023. See disclosures for additional information and definitions.
This report is intended for the exclusive use of clients or prospective clients (the “recipient”) of BGM Wealth Partners and the information contained herein is confidential and the dissemination or distribution to any other person without the prior approval of BGM Wealth Partners is strictly prohibited. Information has been obtained from sources believed to be reliable, though not independently verified. Any forecasts are hypothetical and represent future expectations and not actual return volatilities and correlations will differ from forecasts. This report does not represent a specific investment recommendation. The opinions and analysis expressed herein are based on BGM Wealth Partners research and professional experience and are expressed as of the date of this report. Please consult with your advisor, attorney and accountant, as appropriate, regarding specific advice. Past performance does not indicate future performance and there is risk of loss.
Disclosures & Definitions
Comparisons to any indices referenced herein are for illustrative purposes only and are not meant to imply that actual returns or volatility will be similar to the indices. Indices cannot be invested in directly. Unmanaged index returns assume reinvestment of any and all distributions and do not reflect our fees or expenses.
- The S&P 500 is a capitalization-weighted index designed to measure performance of the broad domestic economy through changes in the aggregate market value of 500 stocks representing all major industries.
- Russell 2000 consists of the 2,000 smallest U.S. companies in the Russell 3000 index.
- MSCI EAFE is an equity index which captures large and mid-cap representation across Developed Markets countries around the world, excluding the U.S. and Canada. The index covers approximately 85% of the free float-adjusted market capitalization in each country.
- MSCI Emerging Markets captures large and mid-cap representation across Emerging Markets countries. The index covers approximately 85% of the free-float adjusted market capitalization in each country.
- Bloomberg U.S. Aggregate Index covers the U.S. investment grade fixed rate bond market, with index components for government and corporate securities, mortgage pass-through securities, and asset-backed securities.
- Bloomberg U.S. Corporate High Yield Index covers the universe of fixed rate, non-investment grade debt. Eurobonds and debt issues from countries designated as emerging markets (sovereign rating of Baa1/BBB+/BBB+ and below using the middle of Moody’s, S&P, and Fitch) are excluded, but Canadian and global bonds (SEC registered) of issuers in non-EMG countries are included.
- FTSE Nareit All Equity REITs Index is a free-float adjusted, market capitalization-weighted index of U.S. equity REITs. Constituents of the index include all tax-qualified REITs with more than 50 percent of total assets in qualifying real estate assets other than mortgages secured by real property.
- Bloomberg Commodity Index is calculated on an excess return basis and reflects commodity futures price movements. The index rebalances annually weighted 2/3 by trading volume and 1/3 by world production and weight-caps are applied at the commodity, sector and group level for diversification.
- “Staying Invested Rewards Long Term Performance” page 3 chart methodology – Chart shows the growth of $10,000 invested in the Ibbotson US Large Stock Index on January 1, 1961, through December 31, 2023. January returns in inauguration years are assumed to be under the party that is being inaugurated. The first two scenarios are what would occur if an investor only invested when one particular party was president. The third scenario is what would occur if an investor had stayed invested throughout the entire period. Returns include reinvestment of dividends and interest. The example is hypothetical and provided for illustrative purposes only. Indexes are unmanaged, do not incur management fees, costs, and expenses and cannot be invested in directly.
Material Risks
- Fixed Income securities are subject to interest rate risks, the risk of default and liquidity risk. U.S. investors exposed to non-U.S. fixed income may also be subject to currency risk and fluctuations.
- Cash may be subject to the loss of principal and over longer periods of time may lose purchasing power due to inflation.
- Domestic Equity can be volatile. The rise or fall in prices takes place for a number of reasons including, but not limited to changes to underlying company conditions, sector or industry factors, or other macro events. These may happen quickly and unpredictably.
- International Equity can be volatile. The rise or fall in prices takes place for a number of reasons including, but not limited to changes to underlying company conditions, sector or industry impacts, or other macro events. These may happen quickly and unpredictably. International equity allocations may also be impact by currency and/or country specific risks which may result in lower liquidity in some markets.
- Real Assets can be volatile and may include asset segments that may have greater volatility than investment in traditional equity securities. Such volatility could be influenced by a myriad of factors including, but not limited to overall market volatility, changes in interest rates, political and regulatory developments, or other exogenous events like weather or natural disaster.
- Private Real Estate involves higher risk and is suitable only for sophisticated investors. Real estate assets can be volatile and may include unique risks to the asset class like leverage and/or industry, sector or geographical concentration. Declines in real estate value may take place for a number of reasons including, but are not limited to economic conditions, change in condition of the underlying property or defaults by the borrower.